Differential methylation on the site level was computed based on a variety of metrics. Of particular interest for the following plots and analyses are the following quantities for each site: a) the difference in mean methylation levels of the two groups being compared, b) the quotient in mean methylation and c) a statistical test (limma or t-test depending on the settings) assessing whether the methylation values in the two groups originate from distinct distributions. Additionally each site was assigned a rank based on each of these three criteria. A combined rank is computed as the maximum (i.e. worst) rank among the three ranks. The smaller the combined rank for a site, the more evidence for differential methylation it exhibits. This section includes scatterplots of the site group means as well as volcano plots of each pairwise comparison colored according to the combined ranks or p-values of a given site.
The following rank cutfoffs have been automatically selected for the analysis of differentially methylated sites:
| Rank Cutoff | |
| Bone marrow vs. non.Bone marrow (based on TISSUE_TYPE) | 315526 |
| Cord blood vs. non.Cord blood (based on TISSUE_TYPE) | 365793 |
| Tonsil vs. non.Tonsil (based on TISSUE_TYPE) | 2897925 |
| Venous blood vs. non.Venous blood (based on TISSUE_TYPE) | 116653 |
| Female vs. Male (based on DONOR_SEX) | 1789 |
| mono vs. neut (based on cmp_mono_vs_neut) | 2075148 |
| mono vs. neut (based on cmpV_mono_vs_neut) | 751016 |
| mono vs. neut (based on cmpC_mono_vs_neut) | 1945917 |
| Mf vs. mono (based on cmpV_mono_vs_Mf) | 2297046 |
| Mf0 vs. mono (based on cmpV_mono_vs_Mf0) | 2894612 |
| Mf1 vs. mono (based on cmpV_mono_vs_Mf1) | 2297046 |
| Mf2 vs. mono (based on cmpV_mono_vs_Mf2) | 3546039 |
| Mf0 vs. Mf1 (based on cmpV_Mf0_vs_Mf1) | 3017788 |
| Mf0 vs. Mf2 (based on cmpV_Mf0_vs_Mf2) | 2822127 |
| Mf1 vs. Mf2 (based on cmpV_Mf1_vs_Mf2) | 3321182 |
| CD4 vs. CD8 (based on cmpV_Tcells) | 5141962 |
| NK vs. Tcell (based on cmpV_Tcells_vs_NK) | 2697870 |
| Bnaive vs. Tcell (based on cmpV_Tcells_vs_Bnaive) | 2270374 |
| NK vs. TCD4 (based on cmpV_TCD4_vs_NK) | 4797460 |
| NK vs. TCD8 (based on cmpV_TCD8_vs_NK) | 2326117 |
| Bmem vs. Bnaive (based on cmp_Bnaive_vs_Bmem) | 2798392 |
| Bnaive vs. plasma (based on cmp_Bnaive_vs_plasma) | 2323463 |
| Bmem vs. plasma (based on cmp_plasma_vs_Bmem) | 5636418 |
| Bnaive vs. NK (based on cmpV_Bnaive_vs_NK) | 3247137 |
| comparison | |
| differential methylation measure |
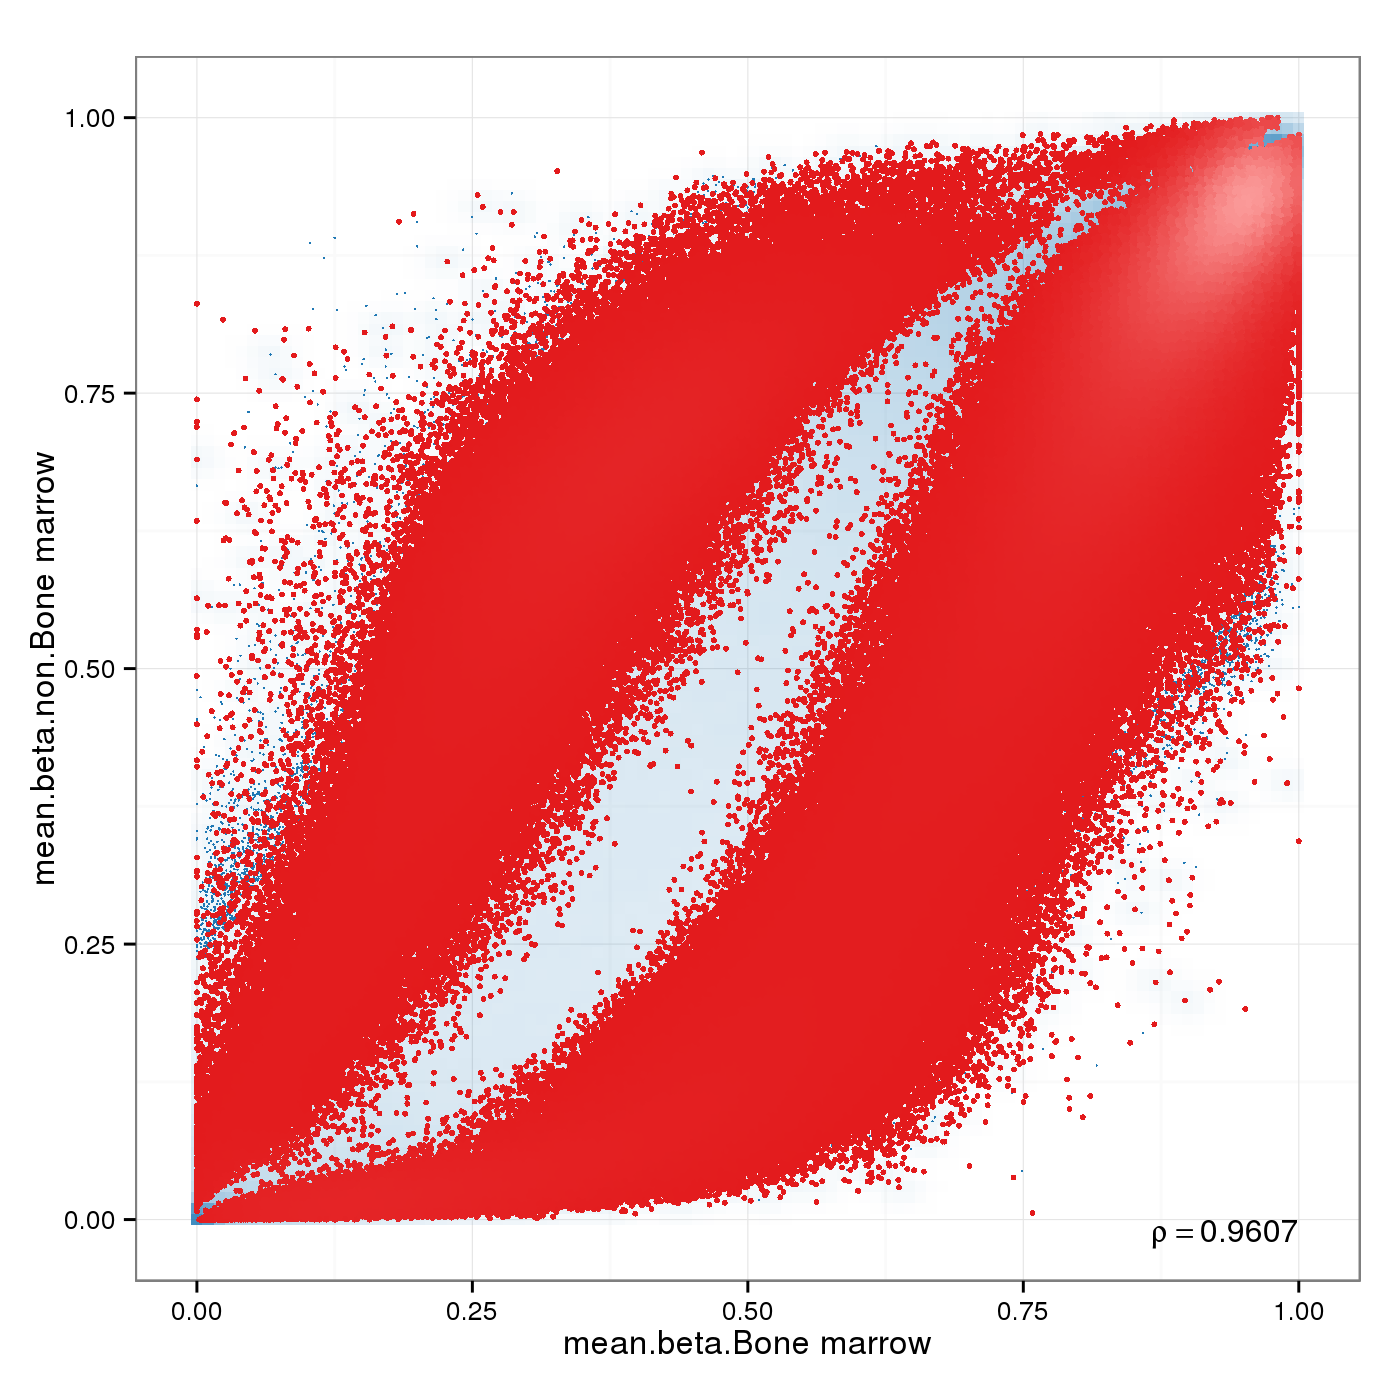
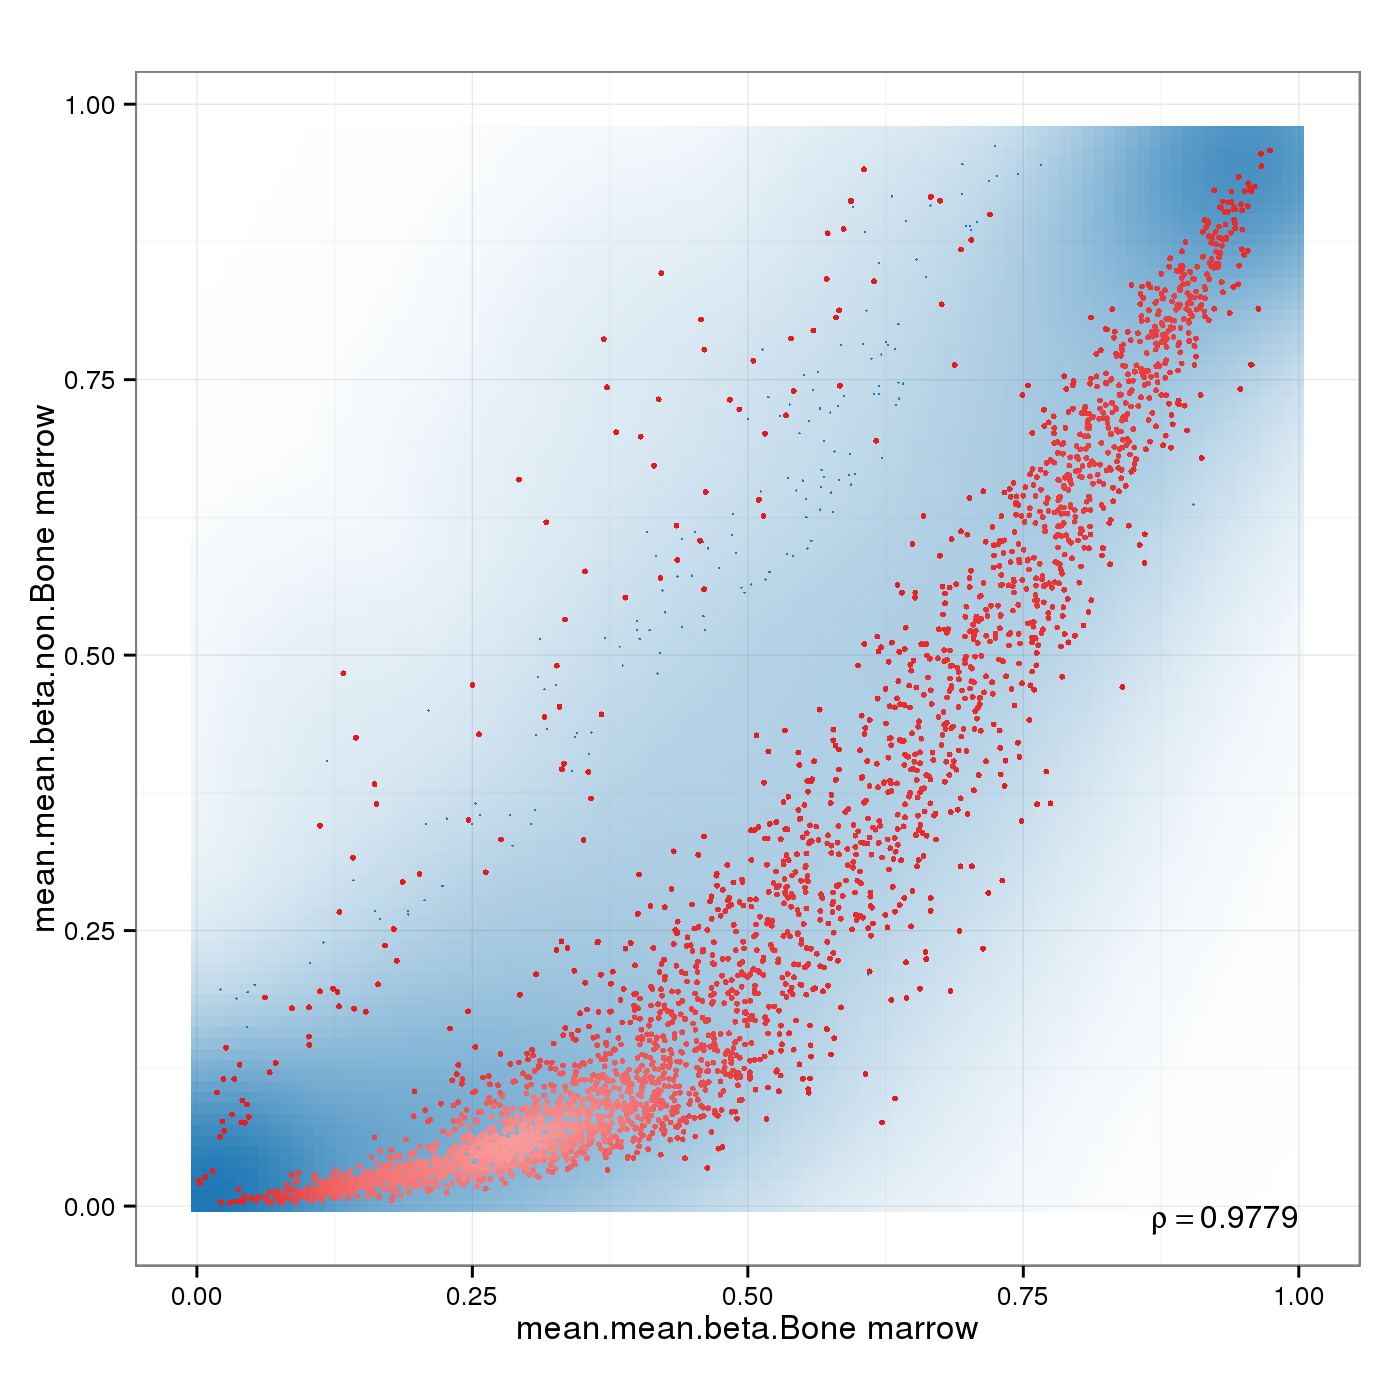
Scatterplot for differential methylation (sites). If the selected criterion is not rankGradient:
The transparency corresponds to point density. If the number of points exceeds 2e+06 then the number of points for density estimation is reduced to that number by random sampling.The1% of the points in the sparsest populated plot regions are drawn explicitly (up to a maximum of 10000 points).Additionally, the colored points represent differentially methylated sites (according to the selected criterion).
If the selected criterion is rankGradient: median combined ranks accross hexagonal bins are shown
as a gradient according to the color legend.
| comparison | |
| difference metric | |
| significance metric |
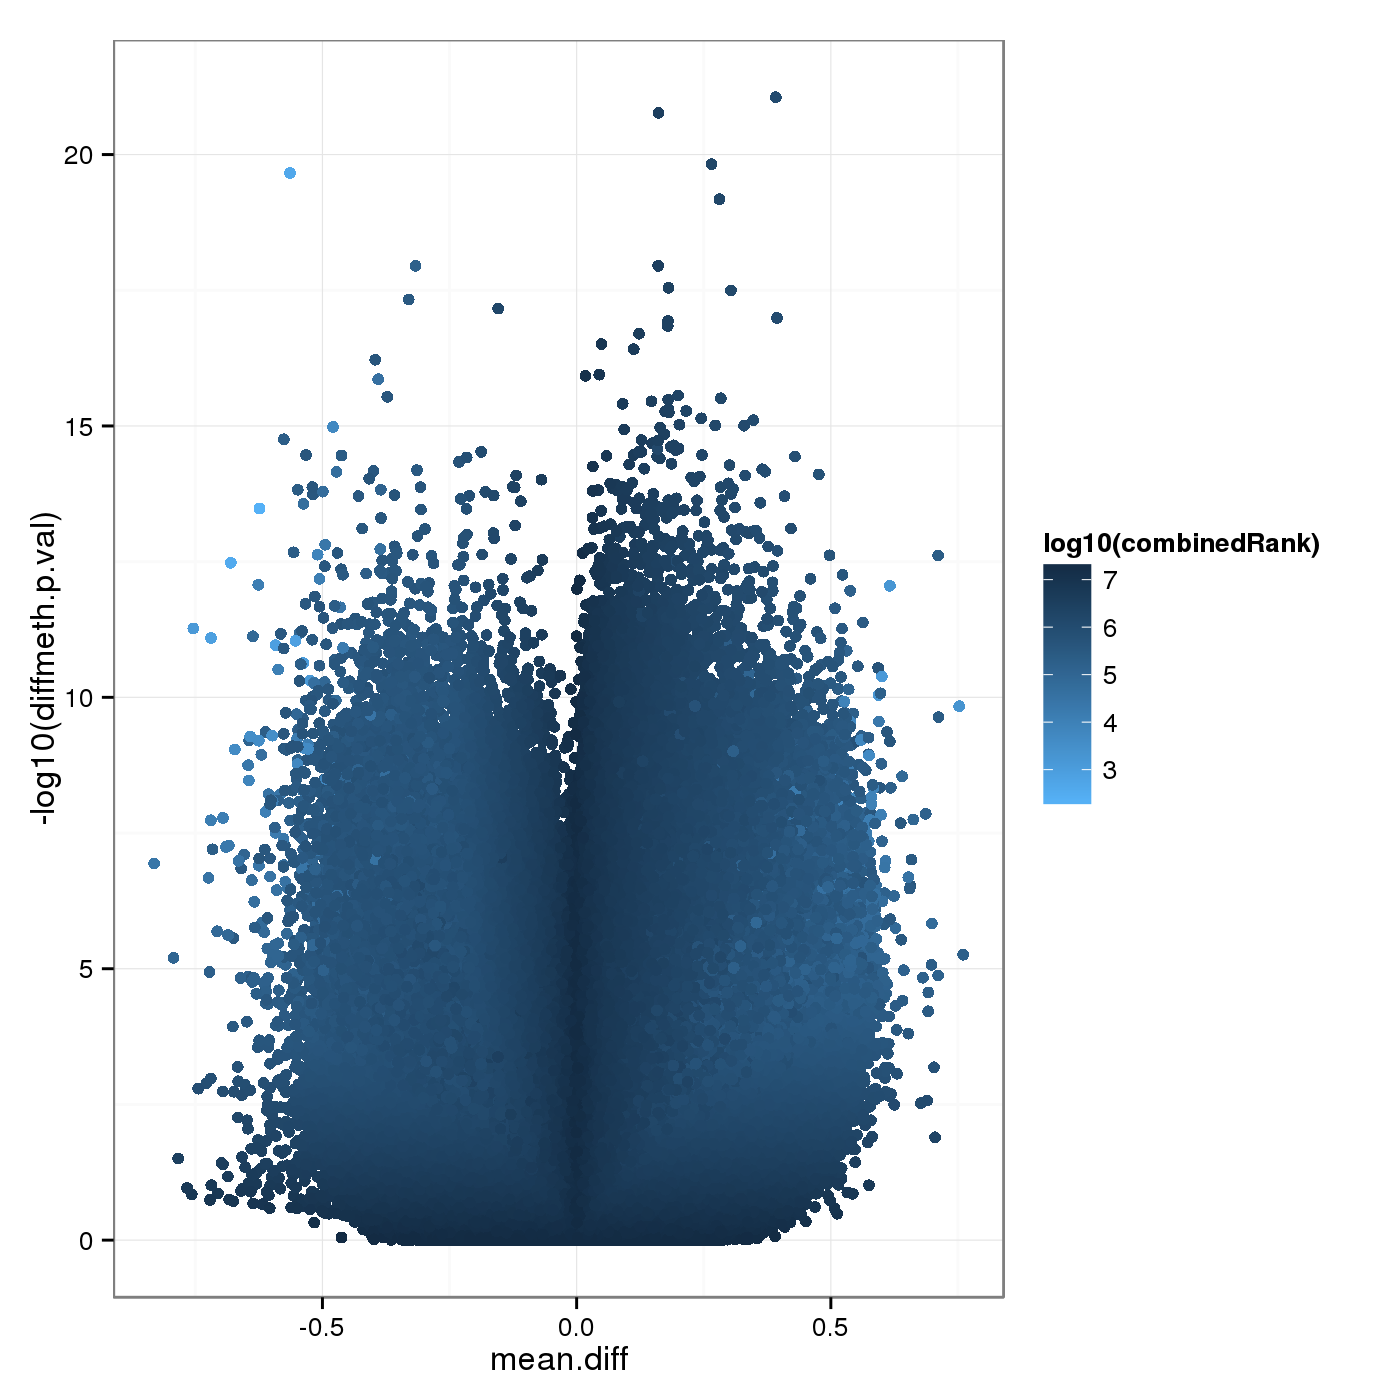
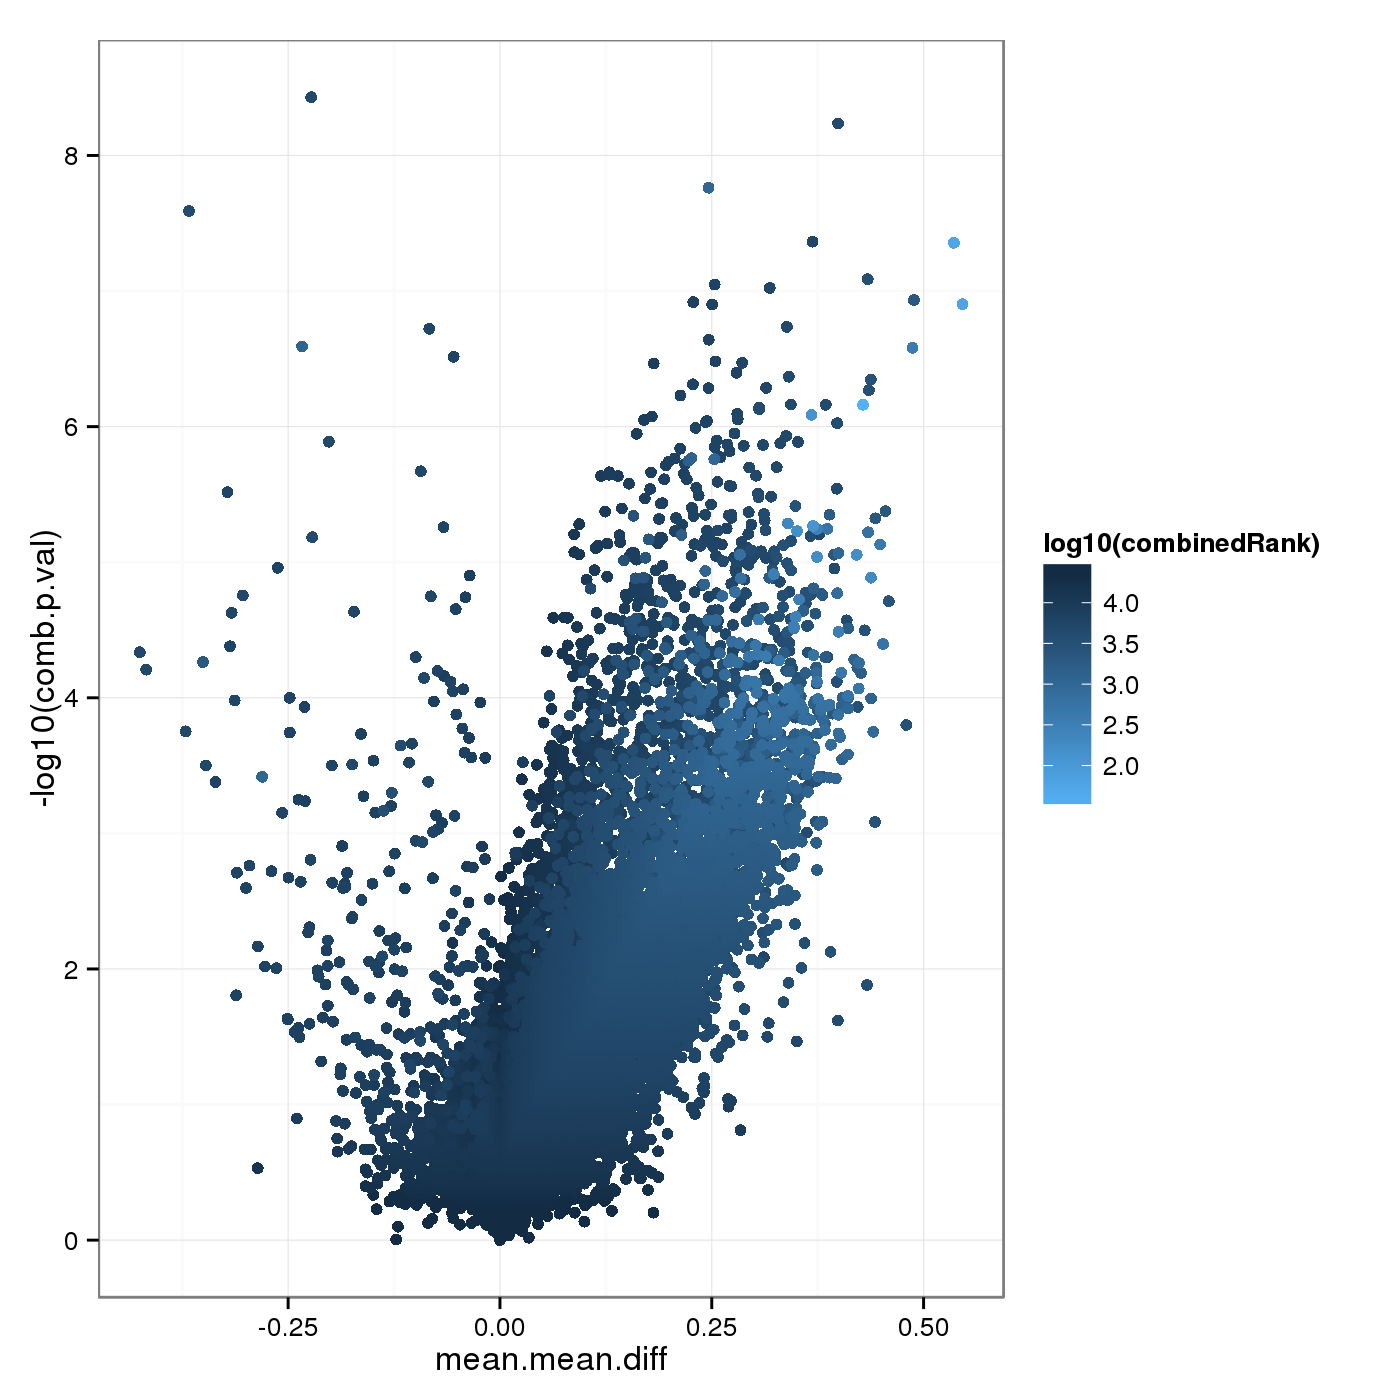
Volcano plot for differential methylation quantified by various metrics. Color scale according to combined ranking.
Differential Methylation Tables
A tabular overview of measures for differential methylation on the site level for the individual comparisons are provided in this section. Below, a brief explanation of the different columns can be found:
- id: site id
- Chromosome: chromosome of the site
- Start: start coordinate of the site
- Strand: strand of the site
- mean.g1,mean.g2: (where g1 and g2 is replaced by the respective group names in the table) mean methylation in each of the two groups
- mean.diff: difference in methylation means between the two groups: mean.g1-mean.g2. In case of paired analysis, it is the mean of the pairwise differences.
- mean.quot.log2: log2 of the quotient in methylation: log2((mean.g1+epsilon)/(mean.g2+epsilon)), where epsilon:=0.01. In case of paired analysis, it is the mean of the pairwise quotients.
- diffmeth.p.val: p-value obtained from linear models employed in the limma package (or alternatively from a two-sided Welch t-test; which type of p-value is computed is specified in the differential.site.test.method option).
- max.g1,max.g2: maximum methylation level in group 1 and 2 respectively
- min.g1,min.g2: minimum methylation level in group 1 and 2 respectively
- sd.g1,sd.g2: standard deviation of methylation levels
- min.diff: Minimum of 0 and the smallest pairwise difference between samples of the two groups
- diffmeth.p.adj.fdr: FDR adjusted p-value of all sites
- combinedRank: mean.diff, mean.quot.log2 and diffmeth.p.val are ranked for all sites. This aggregates them using the maximum, i.e. worst rank of a site among the three measures
- num.na.g1,num.na.g2: number of NA methylation values for groups 1 and 2 respectively
- mean.covg.g1,mean.covg.g2: mean coverage of groups 1 and 2 respectively (In case of Infinium array methylation data, coverage is defined as combined beadcount.)
- min.covg.g1,min.covg.g2: minimum coverage of groups 1 and 2 respectively
- max.covg.g1,max.covg.g2: maximum coverage of groups 1 and 2 respectively
- covg.thresh.nsamples.g1,covg.thresh.nsamples.g2: number of samples in group 1 and 2 respectively exceeding the coverage threshold (5) for this site.
The tables for the individual comparisons can be found here:
- Bone marrow vs. non.Bone marrow (based on TISSUE_TYPE)
- Cord blood vs. non.Cord blood (based on TISSUE_TYPE)
- Tonsil vs. non.Tonsil (based on TISSUE_TYPE)
- Venous blood vs. non.Venous blood (based on TISSUE_TYPE)
- Female vs. Male (based on DONOR_SEX)
- mono vs. neut (based on cmp_mono_vs_neut)
- mono vs. neut (based on cmpV_mono_vs_neut)
- mono vs. neut (based on cmpC_mono_vs_neut)
- Mf vs. mono (based on cmpV_mono_vs_Mf)
- Mf0 vs. mono (based on cmpV_mono_vs_Mf0)
- Mf1 vs. mono (based on cmpV_mono_vs_Mf1)
- Mf2 vs. mono (based on cmpV_mono_vs_Mf2)
- Mf0 vs. Mf1 (based on cmpV_Mf0_vs_Mf1)
- Mf0 vs. Mf2 (based on cmpV_Mf0_vs_Mf2)
- Mf1 vs. Mf2 (based on cmpV_Mf1_vs_Mf2)
- CD4 vs. CD8 (based on cmpV_Tcells)
- NK vs. Tcell (based on cmpV_Tcells_vs_NK)
- Bnaive vs. Tcell (based on cmpV_Tcells_vs_Bnaive)
- NK vs. TCD4 (based on cmpV_TCD4_vs_NK)
- NK vs. TCD8 (based on cmpV_TCD8_vs_NK)
- Bmem vs. Bnaive (based on cmp_Bnaive_vs_Bmem)
- Bnaive vs. plasma (based on cmp_Bnaive_vs_plasma)
- Bmem vs. plasma (based on cmp_plasma_vs_Bmem)
- Bnaive vs. NK (based on cmpV_Bnaive_vs_NK)